S&P 500 valuations reach levels not seen since 2000
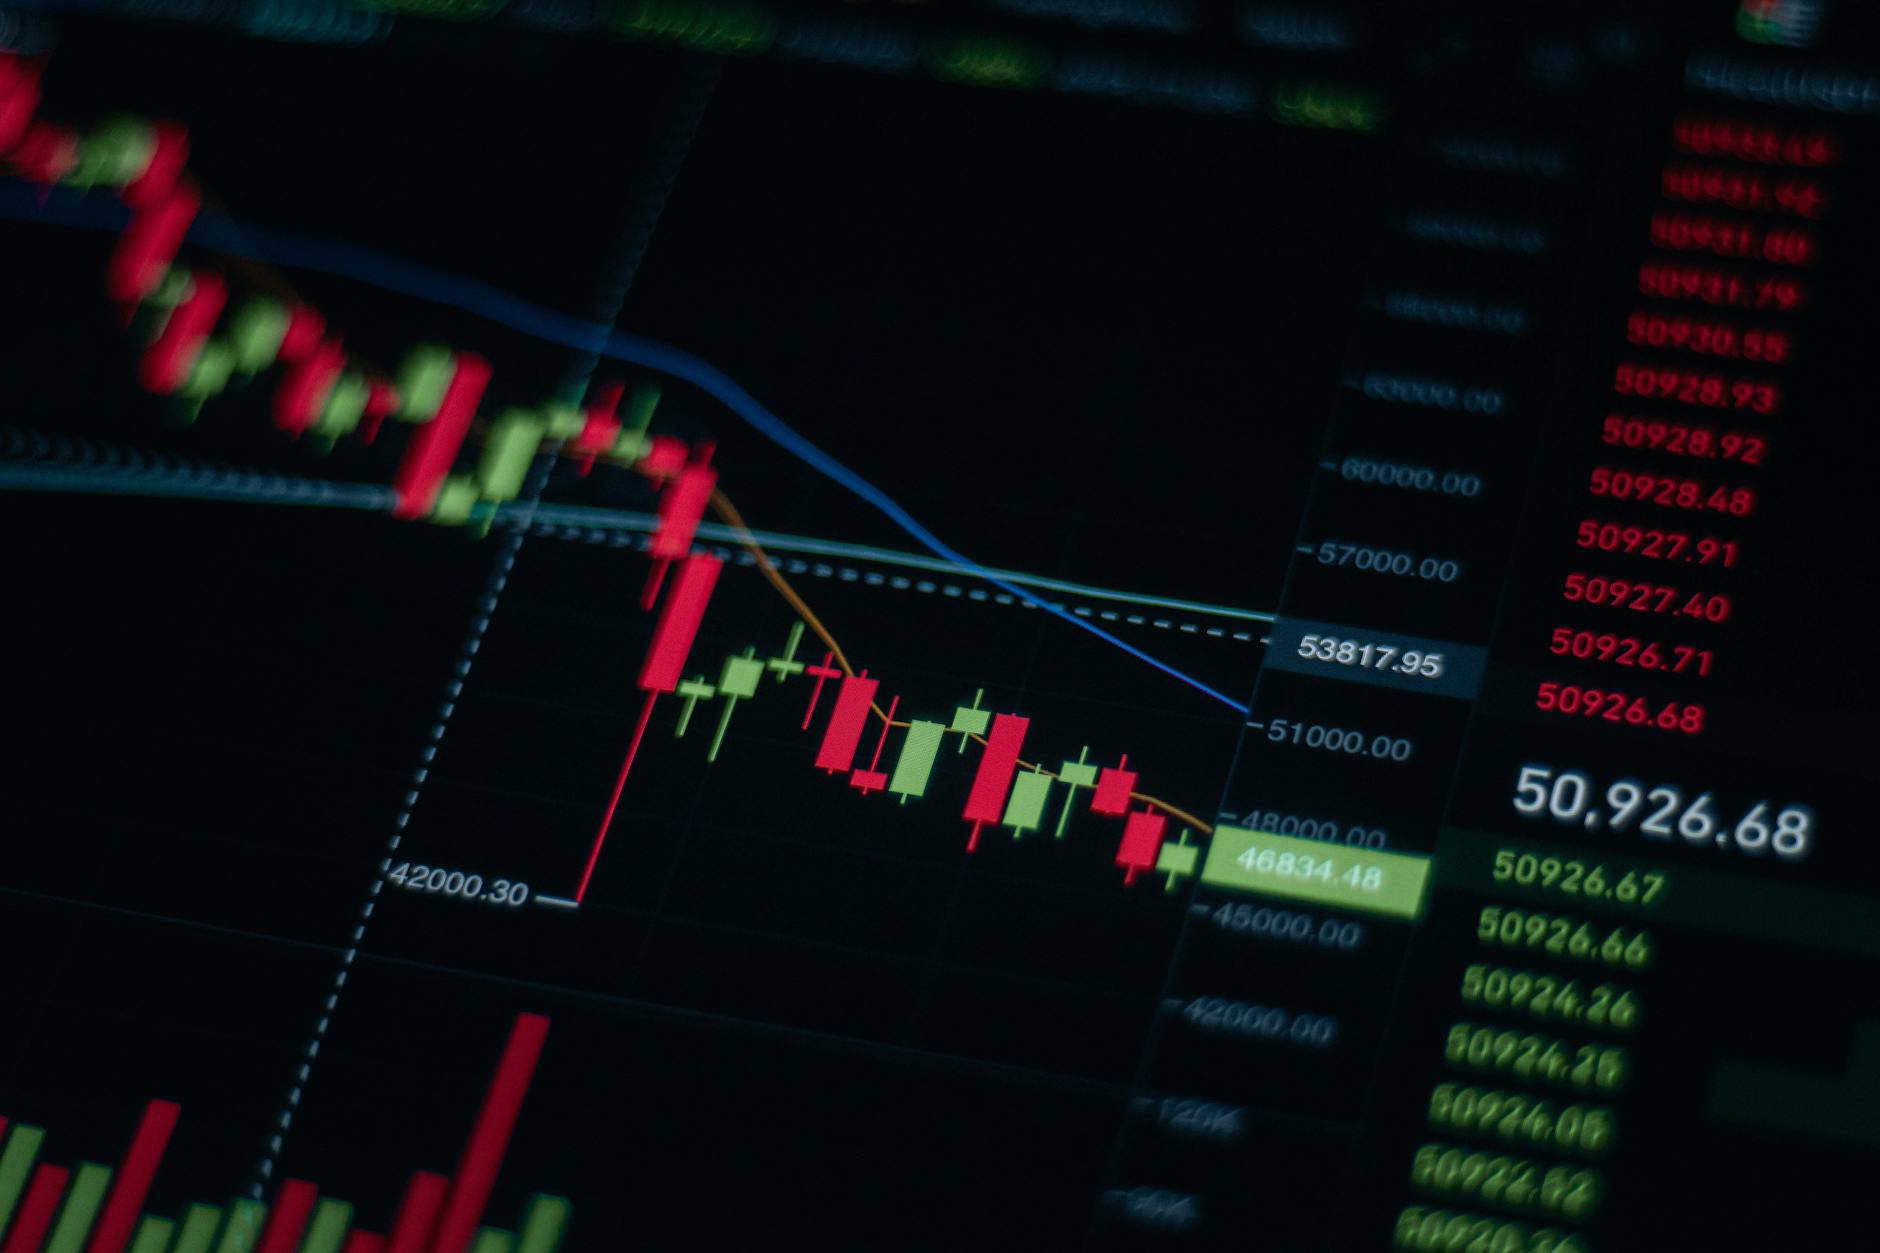
- S&P 500 valuations are at their highest point since the dot-com bubble.
- West Texas Intermediate crude oil has surpassed $100 per barrel.
- Historical data shows that panic selling is the worst action for investors.
The S&P 500 index reached valuation levels not seen since the dot-com bubble that preceded the year 2000. On November 4, 2026, the index closed at 7,568.92 after opening at 7,635.81.
Trading volume reached 4,562,882,000 shares during the session. The index recorded a daily low of 7,635.81 and a daily high of 7,715.57.
Geopolitical conflicts drive oil prices above $100 per barrel
West Texas Intermediate crude oil is trading at over $100 per barrel, up from its 2026 opening price of $57 per barrel. Geopolitical conflicts have disrupted global energy supplies throughout the year.
The United States and Iran have been in a conflict since February that led to the closure of the Strait of Hormuz, which carries 25% of the world’s seaborne oil each day. The war between Saudi Arabia and Yemen has taken additional oil supply offline, while Ukraine and Russia continue to target each other’s energy infrastructure.
Inflation and interest rates pressure corporate earnings
The Consumer Price Index rose at an annualized 3.7% in September, exceeding the Federal Reserve’s 2% target. High oil prices, rising inflation, and interest-rate hikes remain primary risks that could push the S&P 500 lower, according to Fool.com.
Because borrowing costs are higher, companies are hesitant to take on debt to fund expansion, leading investors to price in slower growth and putting downward pressure on stock valuations.
As background, a profit warning occurs when a listed company tells investors that profit for the upcoming quarter will be significantly lower than the same quarter of the previous year, or that the company may incur a loss. Company share prices often decline after a profit warning.
Technology sector concentration poses bear-market threat
The technology sector comprises 38% of the S&P 500. Higher borrowing costs that hinder artificial intelligence data-center projects could trigger another bear-market decline.
The S&P 500’s Shiller CAPE ratio is currently above 40. This is only the second time in history this has occurred; the first was during the dot-com bubble before 2000, after which the index fell 49%.
Unusual market conditions see gold and stocks falling together
Gold, silver, stocks, artificial-intelligence shares, and U.S. bonds are all falling together, a situation social-media posts describe as a first-time-in-history event. This trend is unusual because gold normally acts as a safe haven.
According to Finance.yahoo.com, the S&P 500 returned -0.71% over the past five trading days. Over the past month, the index returned -0.44%, and it returned -0.62% over the past three months.
The index gained 6.78% over the past six months. Year-to-date, the S&P 500 is up 12.32%, with a one-year total return of 13.54%. The two-year total return is 34.59%, and the three-year total return is 76.41%.
Historical data shows bear markets average 36% declines
Stocks lose an average of 36% during bear markets. Nine bear markets have seen declines of at least 25%, and three have fallen more than 40%.
Despite these risks, the S&P 500 has increased to more than twice its level at the 2022 bear-market low.
Long-term investors should avoid panic selling during crashes
Historical data indicates that purchasing an S&P 500 index fund at a bull-market peak and remaining invested eventually results in outperformance.
Panic selling represents the worst action for investors. Purchasing stocks during market crashes has historically produced strong long-term results.
Disclosure of financial interests and data sources
Anthony Di Pizio does not hold any position in any of the stocks referenced in this article. The Motley Fool holds positions in and recommends CME Group and maintains a disclosure policy.
The Motley Fool offers premium services that provide stock recommendations, portfolio guidance, and other investment advice. This report shows average returns of all Motley Fool recommendations since the service began, with cost basis and return calculated using the previous market day close.
Market data used in the report is supplied by Xignite and Polygon.io.
Frequently Asked Questions
- Prediction: A Stock Market Crash Is Coming. Here's What Investors Should Do Based on Nearly 70 Years' Worth of History. | The Motley Fool (fool.com)
- The S&P 500 is flashing a rare signal that hints a recession ... (aol.com)
- Bear markets are brutal — but history shows exactly what ... (facebook.com)
- First time in History Everything is Crashing (instagram.com)
- S&P 500 (^GSPC) Charts, Data & News - Yahoo Finance (finance.yahoo.com)
- Profit warning (Wikipedia — background) (en.wikipedia.org)
Add NewsPulse Time as a preferred source on Google