How Meteorologists Predict Tropical Storm Paths and Intensity
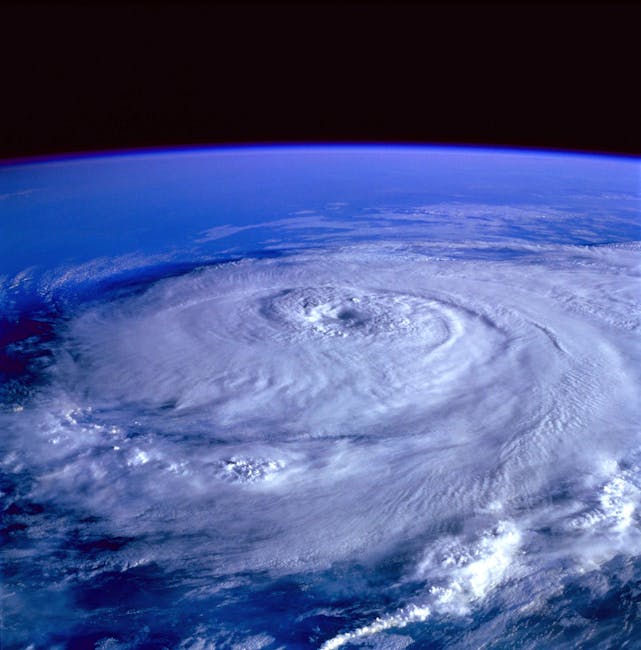
- Supercomputers run multiple simulations to create an ensemble forecast.
- Data comes from satellites, ocean buoys, and specialized aircraft.
- The 'cone of uncertainty' shows where the storm center will likely move.
- Predicting storm intensity is much harder than predicting the path.
How do weather prediction models simulate storms?
Tropical storm forecasts rely on supercomputers running complex mathematical models that simulate the atmosphere's physics. These machines crunch millions of data points from satellites, ocean buoys, and weather balloons to predict where a storm will move. The process starts with a global model, which provides a wide view of the world’s weather patterns. Then, regional models focus on specific areas to add necessary detail. Because the atmosphere is chaotic, forecasters run the same simulation dozens of times with slight variations to see a range of outcomes. This ensemble approach helps meteorologists understand the level of uncertainty in a storm's path. While technology has improved, predicting intensity remains difficult because storms feed on unpredictable ocean heat.
Why is ensemble forecasting used to manage uncertainty?
To build a map, computers need a starting point. They pull in massive amounts of data from geostationary satellites that monitor cloud temperatures and moisture levels. Ocean buoys provide essential readings on water temperature and surface pressure. According to the World Meteorological Organization, these sensors are critical for establishing the initial conditions of a storm. But, automated tools cannot see everything. Meteorologists often send specialized aircraft directly into a storm to drop sensors called dropsondes. These devices measure wind speed and pressure at different altitudes as they fall toward the ocean. Without this human-assisted data, models would lose significant accuracy in the first 24 hours of a storm's life.
What role does meteorological data analysis play?
Think of the atmosphere as a giant 3D grid. Each grid point contains values for temperature, wind speed, and humidity. Models use physics equations to calculate how these values change over time. If a storm is sitting at one point, the model calculates if it will push into the next grid square. This process repeats for thousands of steps into the future. A standard model might have a grid resolution of 10 to 20 kilometers. When the computer finishes these calculations, it produces a visual map of the predicted track. This digital math is what drives the path forecasts you see on the news.
How does atmospheric simulation improve forecast accuracy?
The famous cone on a weather map is not a forecast of the storm's size. It represents the historical error rate of the National Hurricane Center over the previous five years. Meteorologists draw the circle based on how far off their predictions have been in the past. If the cone is wide, it means the storm is moving in a complex environment where models disagree. If the cone is narrow, the models are in high agreement. You should never look at the cone and assume the area outside is safe. Storms bring rain and wind far beyond the center point shown on the map.
Why is storm intensity so hard to predict?
Predicting where a storm goes is a math problem. Predicting how strong it gets is a biology and chemistry problem. A storm's strength depends on the interaction between its internal structure and the ocean surface. If a storm hits a patch of deep, warm water, it can explode in intensity within a few hours. Models often struggle to capture these rapid changes because the ocean's heat content is not always measured accurately. This is a significant downside of current forecasting. Even when the track is perfect, the wind speed prediction can be off by an entire category.
How can you track storms reliably?
You should check the National Hurricane Center website for the official, government-backed data. It is the primary source for all public warnings. While many apps exist, they often display information that is hours behind the official update. Look for the 'forecast discussion' text on the site if you want to understand the forecaster's reasoning. They will explicitly state if a model is failing or if the path is highly uncertain. Use these tools to plan your safety, but remember that nature is rarely perfectly predictable.
Frequently asked questions
Meteorologists use numerical weather prediction (NWP) models that ingest atmospheric data into supercomputers. These models simulate physical laws—like fluid dynamics and thermodynamics—to project how a storm will move through the atmosphere over time.
Ensemble forecasting involves running a model multiple times with slightly different initial conditions. By comparing the results, forecasters can identify the range of possible outcomes and determine the level of confidence or uncertainty in a storm's path.
Predicting intensity is difficult because it depends on complex, small-scale interactions between the storm and its environment, such as ocean heat content, vertical wind shear, and internal eye-wall dynamics, which are harder to measure and model than large-scale steering currents.
Forecasters rely on a combination of satellite imagery, reconnaissance aircraft (hurricane hunters), ocean buoys, and radar to gather real-time data on wind speed, pressure, and moisture, which are then fed into predictive models.