Rugby vs. NFL: Why Rugby Offers Superior Investment Returns
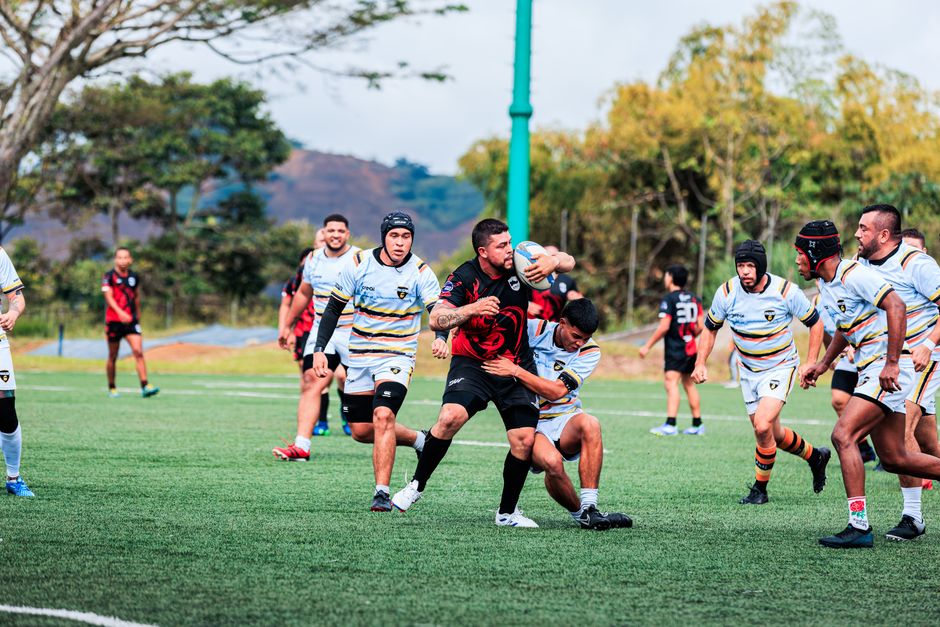
- Rugby provides higher ball-in-play time than football or baseball.
- Smaller match-day rosters create a leaner, more efficient cost structure.
- Salary caps in major leagues prevent the financial bloat found in other sports.
- Limited broadcast reach remains the primary barrier to mass-market competition.
How does the rugby business model compare to the NFL?
Rugby delivers higher engagement per dollar spent compared to football or baseball because the game avoids constant commercial interruptions. While a typical three-hour football broadcast is packed with roughly forty-five minutes of actual play, a rugby match packs nearly sixty minutes of continuous action into an eighty-minute window. This density creates a more efficient product for broadcasters and sponsors. You get more game for your time. But there is a catch. The sport faces steep barriers to entry in markets dominated by established leagues like the NFL. If you want a product that demands attention rather than just serving as background noise, rugby is the superior choice. It shifts the value proposition from passive viewing to active, high-intensity engagement.
Why is sports broadcasting efficiency a key financial metric?
NFL teams maintain rosters of 53 players, necessitating massive payrolls and deep, expensive reserves. A standard rugby union squad relies on a match-day squad of only 23 players. These lower overheads per match day allow clubs to operate with leaner balance sheets. But, this lean structure makes teams vulnerable to injury clusters. When three key starters go down in a match, the performance dip is often sharper than in deeper, more bloated leagues. You are paying for a high-performance engine that lacks a spare tire.
What drives the long-term value of sports media rights?
The barrier to entry for rugby remains the dominance of legacy sports. In the United States, the NFL generates over $11 billion in annual media rights. Rugby’s global television contracts, while growing, remain a fraction of that total. You are investing in a sport with high fan loyalty but limited domestic broadcast reach. It is a niche play compared to the blue-chip reliability of major American leagues. Unless broadcast distribution expands significantly, the sport will struggle to capture the casual viewer's wallet.
Are there significant sports market barriers for new leagues?
Many rugby leagues operate under strict salary caps to prevent financial collapse. For instance, the Gallagher Premiership implemented a cap of £5 million per season to ensure competitive parity. Unlike the uncapped spending sprees seen in European soccer, this keeps the sport solvent. It prevents the winner-take-all dynamic that often ruins competitive balance in other industries. It forces management to prioritize talent development over buying championships.
How do you calculate engagement per dollar in professional sports?
The long-term outlook for the sport depends on market expansion. As rugby explores new territories, it seeks to replicate the commercial success of the Six Nations tournament. The challenge is converting casual interest into consistent ticket and merchandise revenue. It will not overtake the NFL anytime soon. Still, it provides a unique risk-reward profile for those tired of the interrupt-heavy models of traditional sports. It is a product built for the modern attention span.
Frequently asked questions
Rugby often provides higher engagement per dollar due to continuous gameplay and fewer commercial interruptions, though the NFL maintains a significantly larger total market capitalization.
Frequent commercial breaks can lead to viewer fatigue and lower retention. Sports with continuous play, like rugby, maintain higher audience engagement rates, which increases the long-term value of their media rights.
The primary metric is engagement per dollar, which calculates how effectively a league converts broadcasting time and commercial slots into sustained viewer attention and brand loyalty.