Is the Stock Market Open Today? How to Check Status and Hours
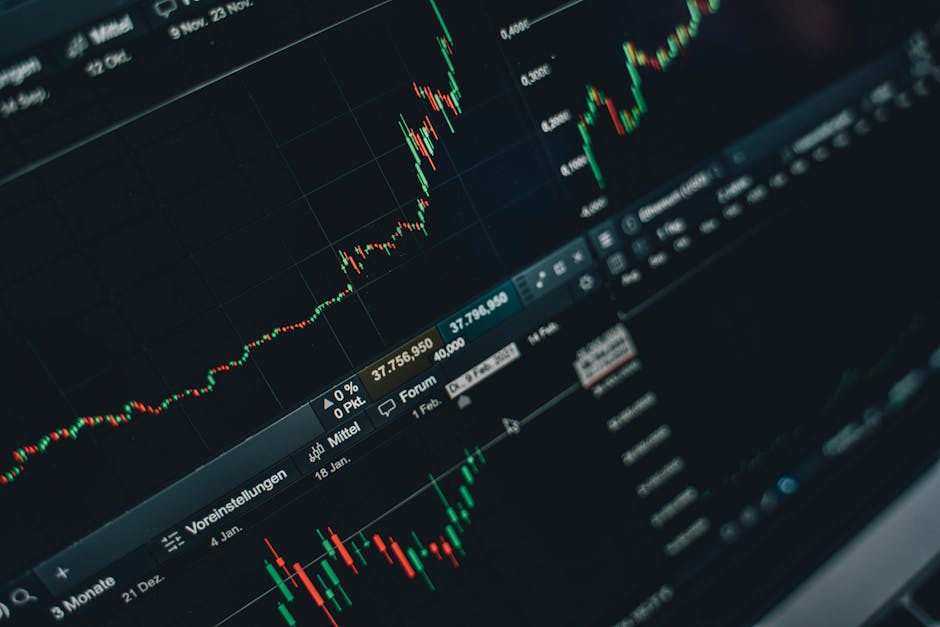
- Stock markets are closed on weekends; check Monday morning for the next movement.
- Use broad indices like the S&P 500 to gauge total market health.
- Monitor individual ticker symbols for specific asset performance.
- Avoid frequent checking to reduce emotional trading risks.
What are the standard stock market hours?
The stock market today, Sunday, September 13, 2026, is currently closed. Major U.S. exchanges like the New York Stock Exchange and Nasdaq do not operate on weekends. Because of this, the prices you see online reflect the closing data from the previous Friday session. To see the most recent status, check a financial news site or a brokerage app. Look for the 'Market Status' indicator, which will explicitly state if the market is open, closed, or in pre-market hours. If you see a price, verify that it is the closing price from Friday. Checking the market during off-hours is useful for planning, but keep in mind that actual trading cannot happen until the opening bell rings on Monday morning.
Is the stock market open today?
Finding reliable price data is straightforward if you use the right tools. Most investors rely on platforms like Yahoo Finance, Google Finance, or their personal brokerage interface. Type the company name or ticker symbol, such as 'AAPL' for Apple or 'MSFT' for Microsoft, into the search bar. The results will show the last traded price, the daily change in dollars, and the percentage movement. But be careful with delayed data. Some free services provide quotes with a 15-minute delay during trading hours. If you are planning an immediate trade, ensure your platform provides real-time streaming data. Your brokerage account likely offers this for free, while general news sites might require a subscription to remove the delay. Always check the timestamp next to the price.
How do you find real-time stock prices?
Indices act like a thermometer for the economy. The S&P 500 tracks 500 of the largest companies in the U.S. and is often seen as the best reflection of overall market health. If the S&P 500 is up, it generally means most large companies are performing well. Other common indices include the Dow Jones Industrial Average, which tracks 30 major blue-chip stocks, and the Nasdaq Composite, which focuses heavily on technology companies. Comparing these three helps you understand where the movement is coming from. For example, if the Nasdaq is down while the Dow is flat, technology stocks are likely dragging the market lower. Using an index gives you a quick snapshot of sentiment without needing to look at thousands of individual stock charts.
What are pre-market trading hours?
Market movement is rarely about one single event. It is usually the result of incoming news, such as quarterly earnings reports, inflation data, or interest rate decisions from the Federal Reserve. When a company announces better-than-expected earnings, its stock price often jumps. Conversely, if a company misses its revenue targets, investors may sell, driving the price down. Macroeconomic factors also play a massive role. If interest rates rise, borrowing becomes more expensive, which can hurt company profits and lower stock prices across the board. Always read the 'News' or 'Analysis' tab on your financial portal to see what events are driving the day. Understanding the 'why' helps you avoid panic when you see red numbers on your screen.
Should I buy or sell today?
Deciding to buy or sell should rely on your personal goals, not the daily market swing. If you are a long-term investor, a single day of volatility should not change your strategy. Many successful investors use a method called dollar-cost averaging. This means investing a set amount of money at regular intervals, regardless of whether the market is up or down. By doing this, you buy more shares when prices are low and fewer when prices are high. The downside of trying to time the market is that you might miss out on the best performing days. According to historical data from firms like Fidelity, missing just a few of the market's strongest days can significantly reduce your long-term returns. Stick to your plan.
How can you monitor your investment portfolio?
Tracking your personal gains requires more than just looking at the market index. Log into your brokerage portal to see your specific cost basis and total return. The cost basis is the total amount you originally spent to buy your shares, including fees. Your total return is the current value of your holdings minus your cost basis. Many apps provide a 'Portfolio' view that aggregates all your investments into one chart. This is the most accurate way to see how you are doing. If you only look at the S&P 500, you might feel like you are failing when your specific portfolio is actually performing well. Keep your focus on your own numbers. Your financial goals are the only ones that matter.
Frequently asked questions
The standard trading hours for the New York Stock Exchange (NYSE) and Nasdaq are 9:30 a.m. to 4:00 p.m. ET, Monday through Friday, excluding market holidays.
Yes, major U.S. stock exchanges close for federal holidays such as New Year’s Day, Independence Day, Thanksgiving, and Christmas, among others.
Yes, investors can trade during pre-market (typically 4:00 a.m. to 9:30 a.m. ET) and after-hours (4:00 p.m. to 8:00 p.m. ET) sessions, though liquidity is often lower.
You can check the status of the stock market by visiting financial news websites, using brokerage apps, or searching 'is the stock market open' on Google for a real-time status indicator.