Delhi-NCR PM2.5 levels hit three-year high before Diwali
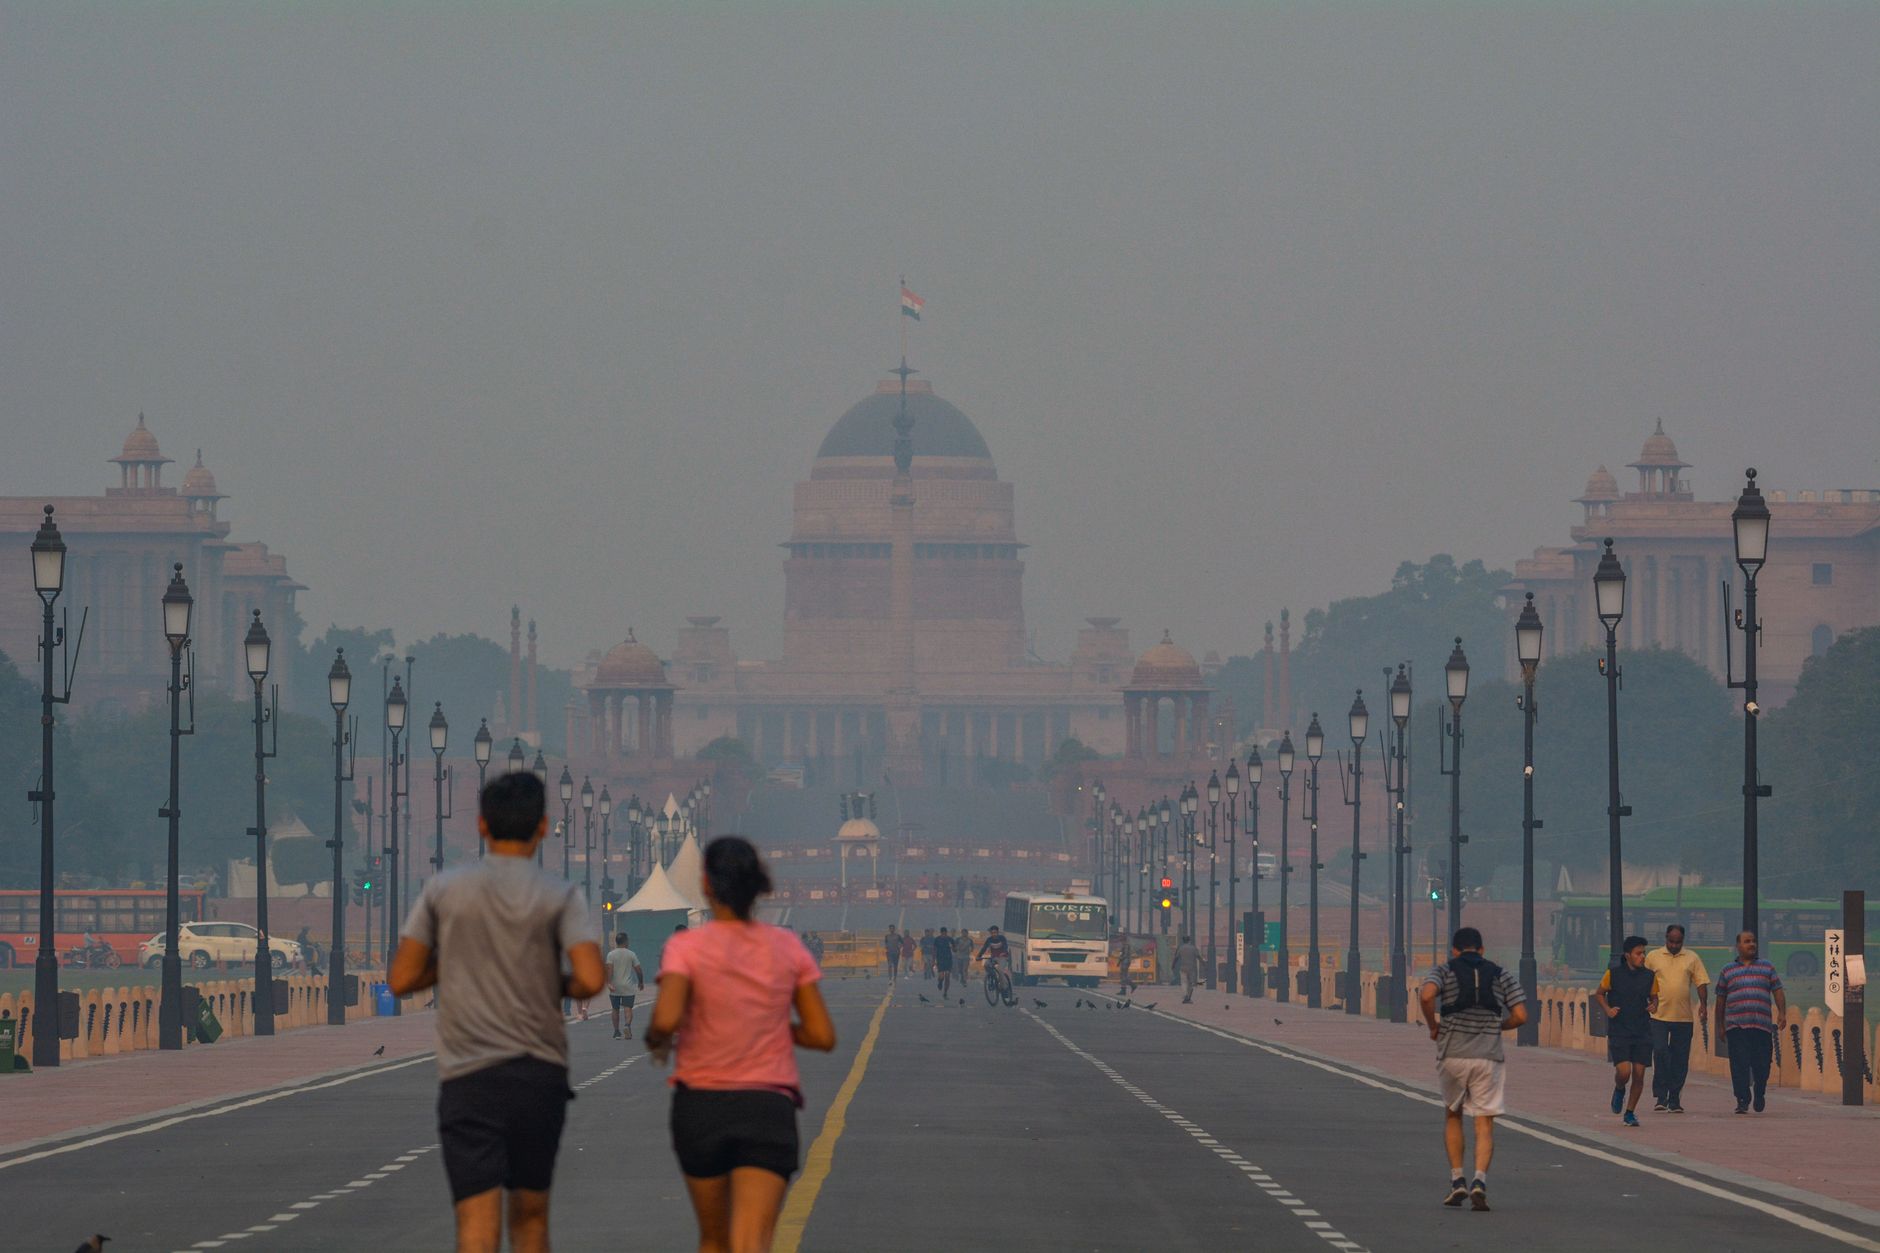
- Delhi-NCR's average PM2.5 level reached 236 micrograms per cubic meter before Diwali.
- This figure represents a 97% increase compared to 2025 and a 32% rise from 2024.
- CSE analysis identifies transport as the primary local source of pollution.
- Emergency restrictions on pre-BS-VI vehicles have failed to reduce traffic congestion.
- CPCB is reviewing its monitoring methodology amid concerns over data gaps.
In the week leading up to Diwali 2026, the region recorded an average PM2.5 level of 236 micrograms per cubic meter, which is the highest level recorded in three years.
Transport identified as primary contributor to local pollution
The CSE analysis identified transport as the primary contributor to local pollution in Delhi-NCR, with traffic congestion data confirming that vehicular emissions are the main cause of daily exposure to toxic pollution. According to the Indian Institute of Tropical Meteorology (IITM) Decision Support System data from November 1 to 8, 33.06 per cent of Delhi's PM2.5 originated from local sources, while 54.43 per cent originated from neighboring NCR districts and 14.29 per cent from stubble burning.
Local pollution sources in Delhi are comprised of 52 per cent vehicular transport, 13 per cent residential activities, 11 per cent peripheral industries, and 7 per cent construction. Energy use and waste burning each account for 5 per cent of the local pollution sources.
Failure of emergency traffic and emission restrictions
Shubham Srivastava, deputy programme manager at CSE, said, "Conventional traffic engineering and piecemeal emergency restrictions cannot absorb this overload," and advocated for strategies to reduce vehicular volume on city roads.
She added that pollution would not have reached this critical state if the air had been cleaner at the start of winter and if stubble burning and firecracker bursting had been effectively curbed.
Experts warn of higher baseline pollution levels
She added that elevated particulate matter levels before the festival indicate a higher baseline of pollution compared to previous years.
Sharanjit Kaur, Deputy Programme Manager at the CSE, said pollution levels before winter 2026 were higher than in 2025. While rainfall caused a brief dip in late September, 2026 saw a significantly worse spike before Diwali.
Roychowdhury attributed this worsening air quality to inadequate emission control.
Daily nitrogen dioxide concentrations increased by one-third from November 2. Sharanjeet Kaur of the CSE Urban Lab said the evening rush loads the air, while still night air prevents dispersion. These levels rise sharply during evening rush hours and remain elevated until midnight.
Stubble burning and hotspot performance
Delhi's air quality index reached 382 on November 6, which triggered the invocation of GRAP Stage III measures.
Between October 1 and November 8, 11 of Delhi's 13 official pollution hotspots recorded lower PM2.5 levels than the same period last year.
Emerging hotspots include Vivek Vihar at 144, Sonia Vihar at 139, ITO at 137, and Delhi Technological University at 135 micrograms per cubic metre.
CPCB methodology under scrutiny amid data gaps
By 2 am, 35 stations remained blank.
The Central Pollution Control Board stated its monitoring system excludes particulate matter concentrations exceeding 1,000 micrograms per cubic metre from hourly calculations. This occurs because the equipment is calibrated to measure only up to that level.
The board's automated validation system treats hourly readings beyond this threshold as outside the limit and excludes them from 24-hour average calculations. Data from the Delhi Pollution Control Committee indicated that concentrations at several locations significantly surpassed this 1,000 micrograms per cubic metre threshold.
The Central Pollution Control Board said the National Air Quality Index is designed to measure prolonged exposure rather than momentary spikes from events like firecracker bursting. The board considers these spikes less relevant for health impact assessments.
The board attributed differences between government and private application readings to measurement methodology rather than under-reporting. It is currently reviewing its methodology to reflect advancements in monitoring technology and evolving international practices.
Understanding the National Air Quality Index
Most pollutants use 24-hour averages, while carbon monoxide and ozone use eight-hour averages. The index categories are 0-50 for good, 51-100 for satisfactory, 101-200 for moderate, 201-300 for poor, 301-400 for very poor, 401-450 for severe, and above 450 for severe plus.
The Central Pollution Control Board said the 500-point cap on the index is a design feature representing the highest level of health concern. This level poses significant risks to both healthy individuals and those with lung diseases.
Frequently Asked Questions
- Even Before Diwali, Delhi-NCR Had Worse Pollution Levels Than Last Year: Study (ndtv.com)
- Delhi pollution: CPCB says extreme PM 2.5 readings not part of AQI methodology amid Diwali data gaps (scroll.in)
- Toxic start to winter: Delhi-NCR's pre-Diwali PM2.5 touches 3-year high, says CSE (newindianexpress.com)
Add NewsPulse Time as a preferred source on Google